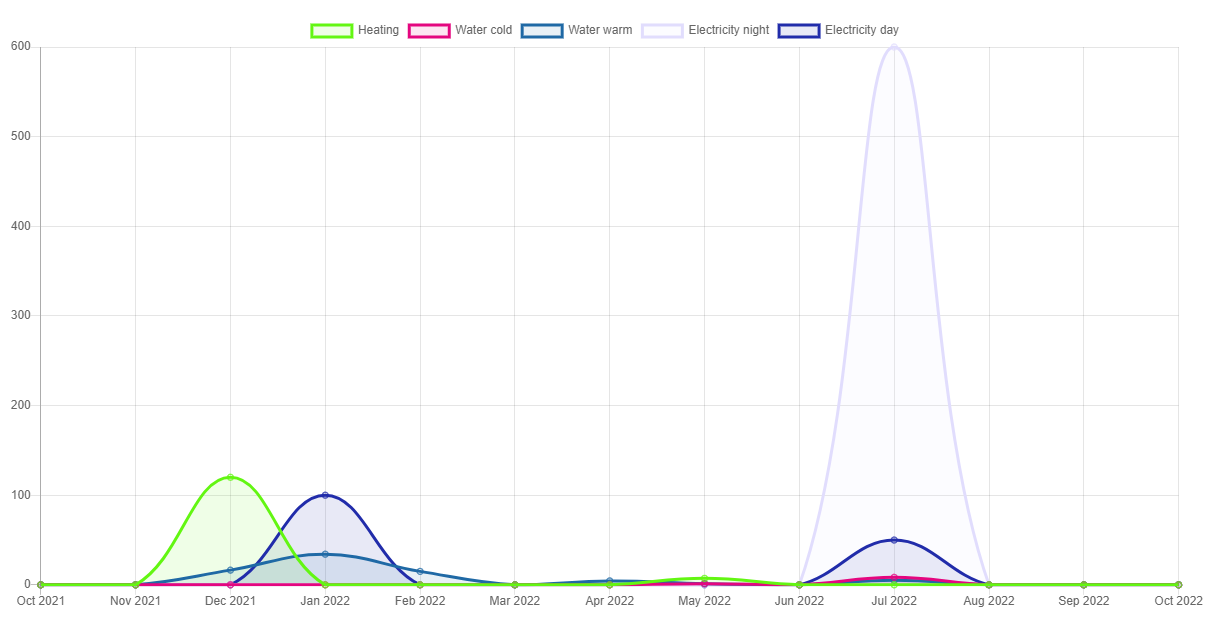
In this section, you can see a clear overview of your building's electricity, water, gas, etc. consumption based on the submitted meter readings for units and buildings. You can see all the submitted meter readings in a year and also on interactive graph.
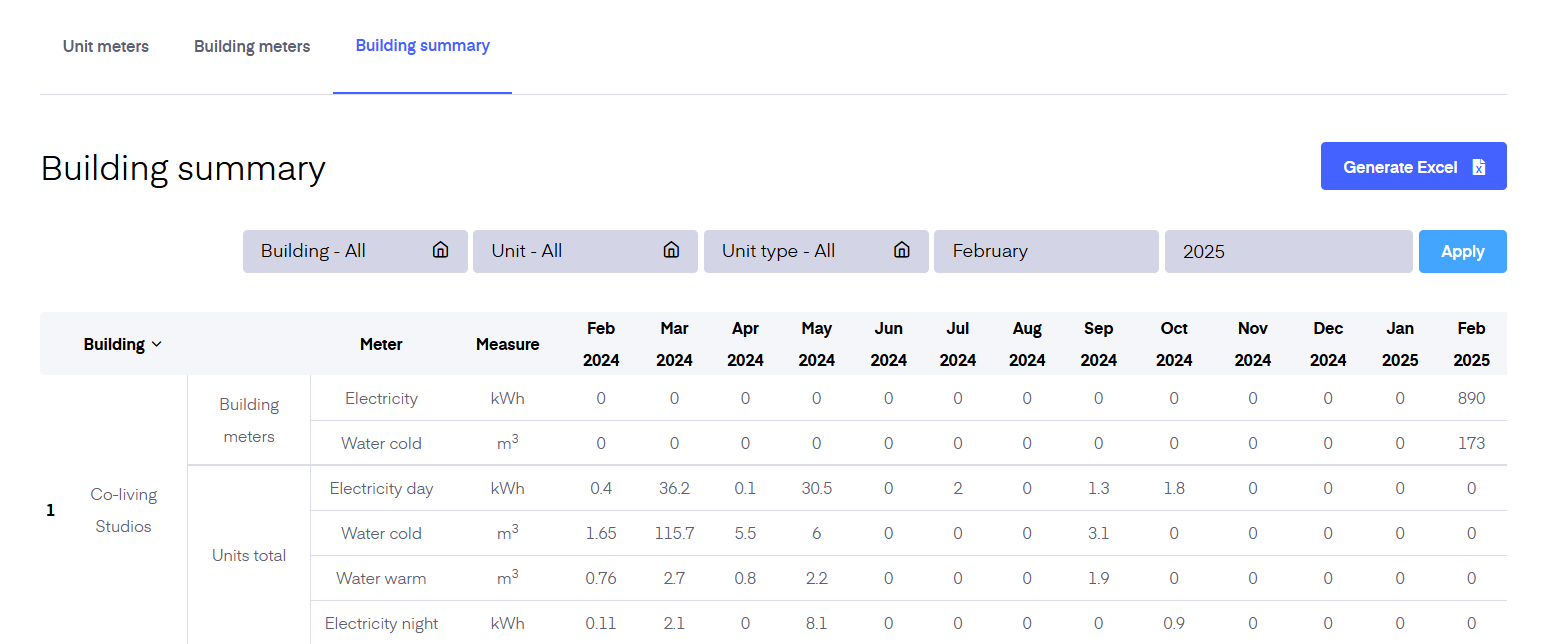
All the data can be filtered, you can filter buildings, units, months, and years. Based on the filtering you can create excel reports of the data. This for example enables you to see which of your buildings or units are more energy-saving or the opposite more wasteful. You can easily download Excel reports of the data to use in planning for more sustainable real estate management.